Roof Measurement Reports With Built-In Material Calculations and a Live Waste Toggle
Reviewed by roofing measurement engineers · References NBC 2020, IRC 2021, FBC 8th Ed. · Roof Manager is the roof measurement & CRM platform trusted by 5,000+ contractors across the US & Canada · Editorial policy.
TL;DR
A roof measurement report should tell you what to order, not just how big the roof is. Here's how Roof Manager builds bundle-level material calculations and a live waste percentage toggle into every report.
A roof measurement report should do more than tell you how big a roof is. It should tell you what to order. Roof Manager's satellite-based roof measurement reports include two features you won't find on a typical aerial roof report: built-in material calculations based on your actual shingle bundle coverage, and a live waste percentage toggle that recalculates every number on the report in real time.
This guide breaks down what a standard roof measurement report includes, where most reports stop short, and how Roof Manager closes the gap between measuring a roof and ordering the materials to build it. Want to skip ahead and just look at one? View a real example report here — it's a live, unedited report generated for a real Toronto address.
Key Takeaways
- Every Roof Manager roof report includes a material calculation, based on 33.3 sq ft of coverage per bundle (3 bundles per square) by default.
- Bundle coverage is adjustable in your account settings, so premium shingles that run 4 or 5 bundles per square calculate correctly too.
- A waste percentage toggle at the top of every report updates the measurements live — no static waste tables and no redoing the math by hand.
- Reports are delivered in about an hour, with roughly 99% accuracy, everywhere in the United States and Canada.
What Is a Roof Measurement Report?
A roof measurement report is a document that uses satellite or aerial imagery to calculate a roof's dimensions — total area, pitch, ridges, hips, valleys, eaves, and rakes — without anyone climbing on the roof. Roofing contractors use these reports to build estimates, order materials, and quote jobs in a fraction of the time hand-measuring takes. Insurance adjusters lean on them to settle claims, and solar installers use the same measurements to plan panel layouts.
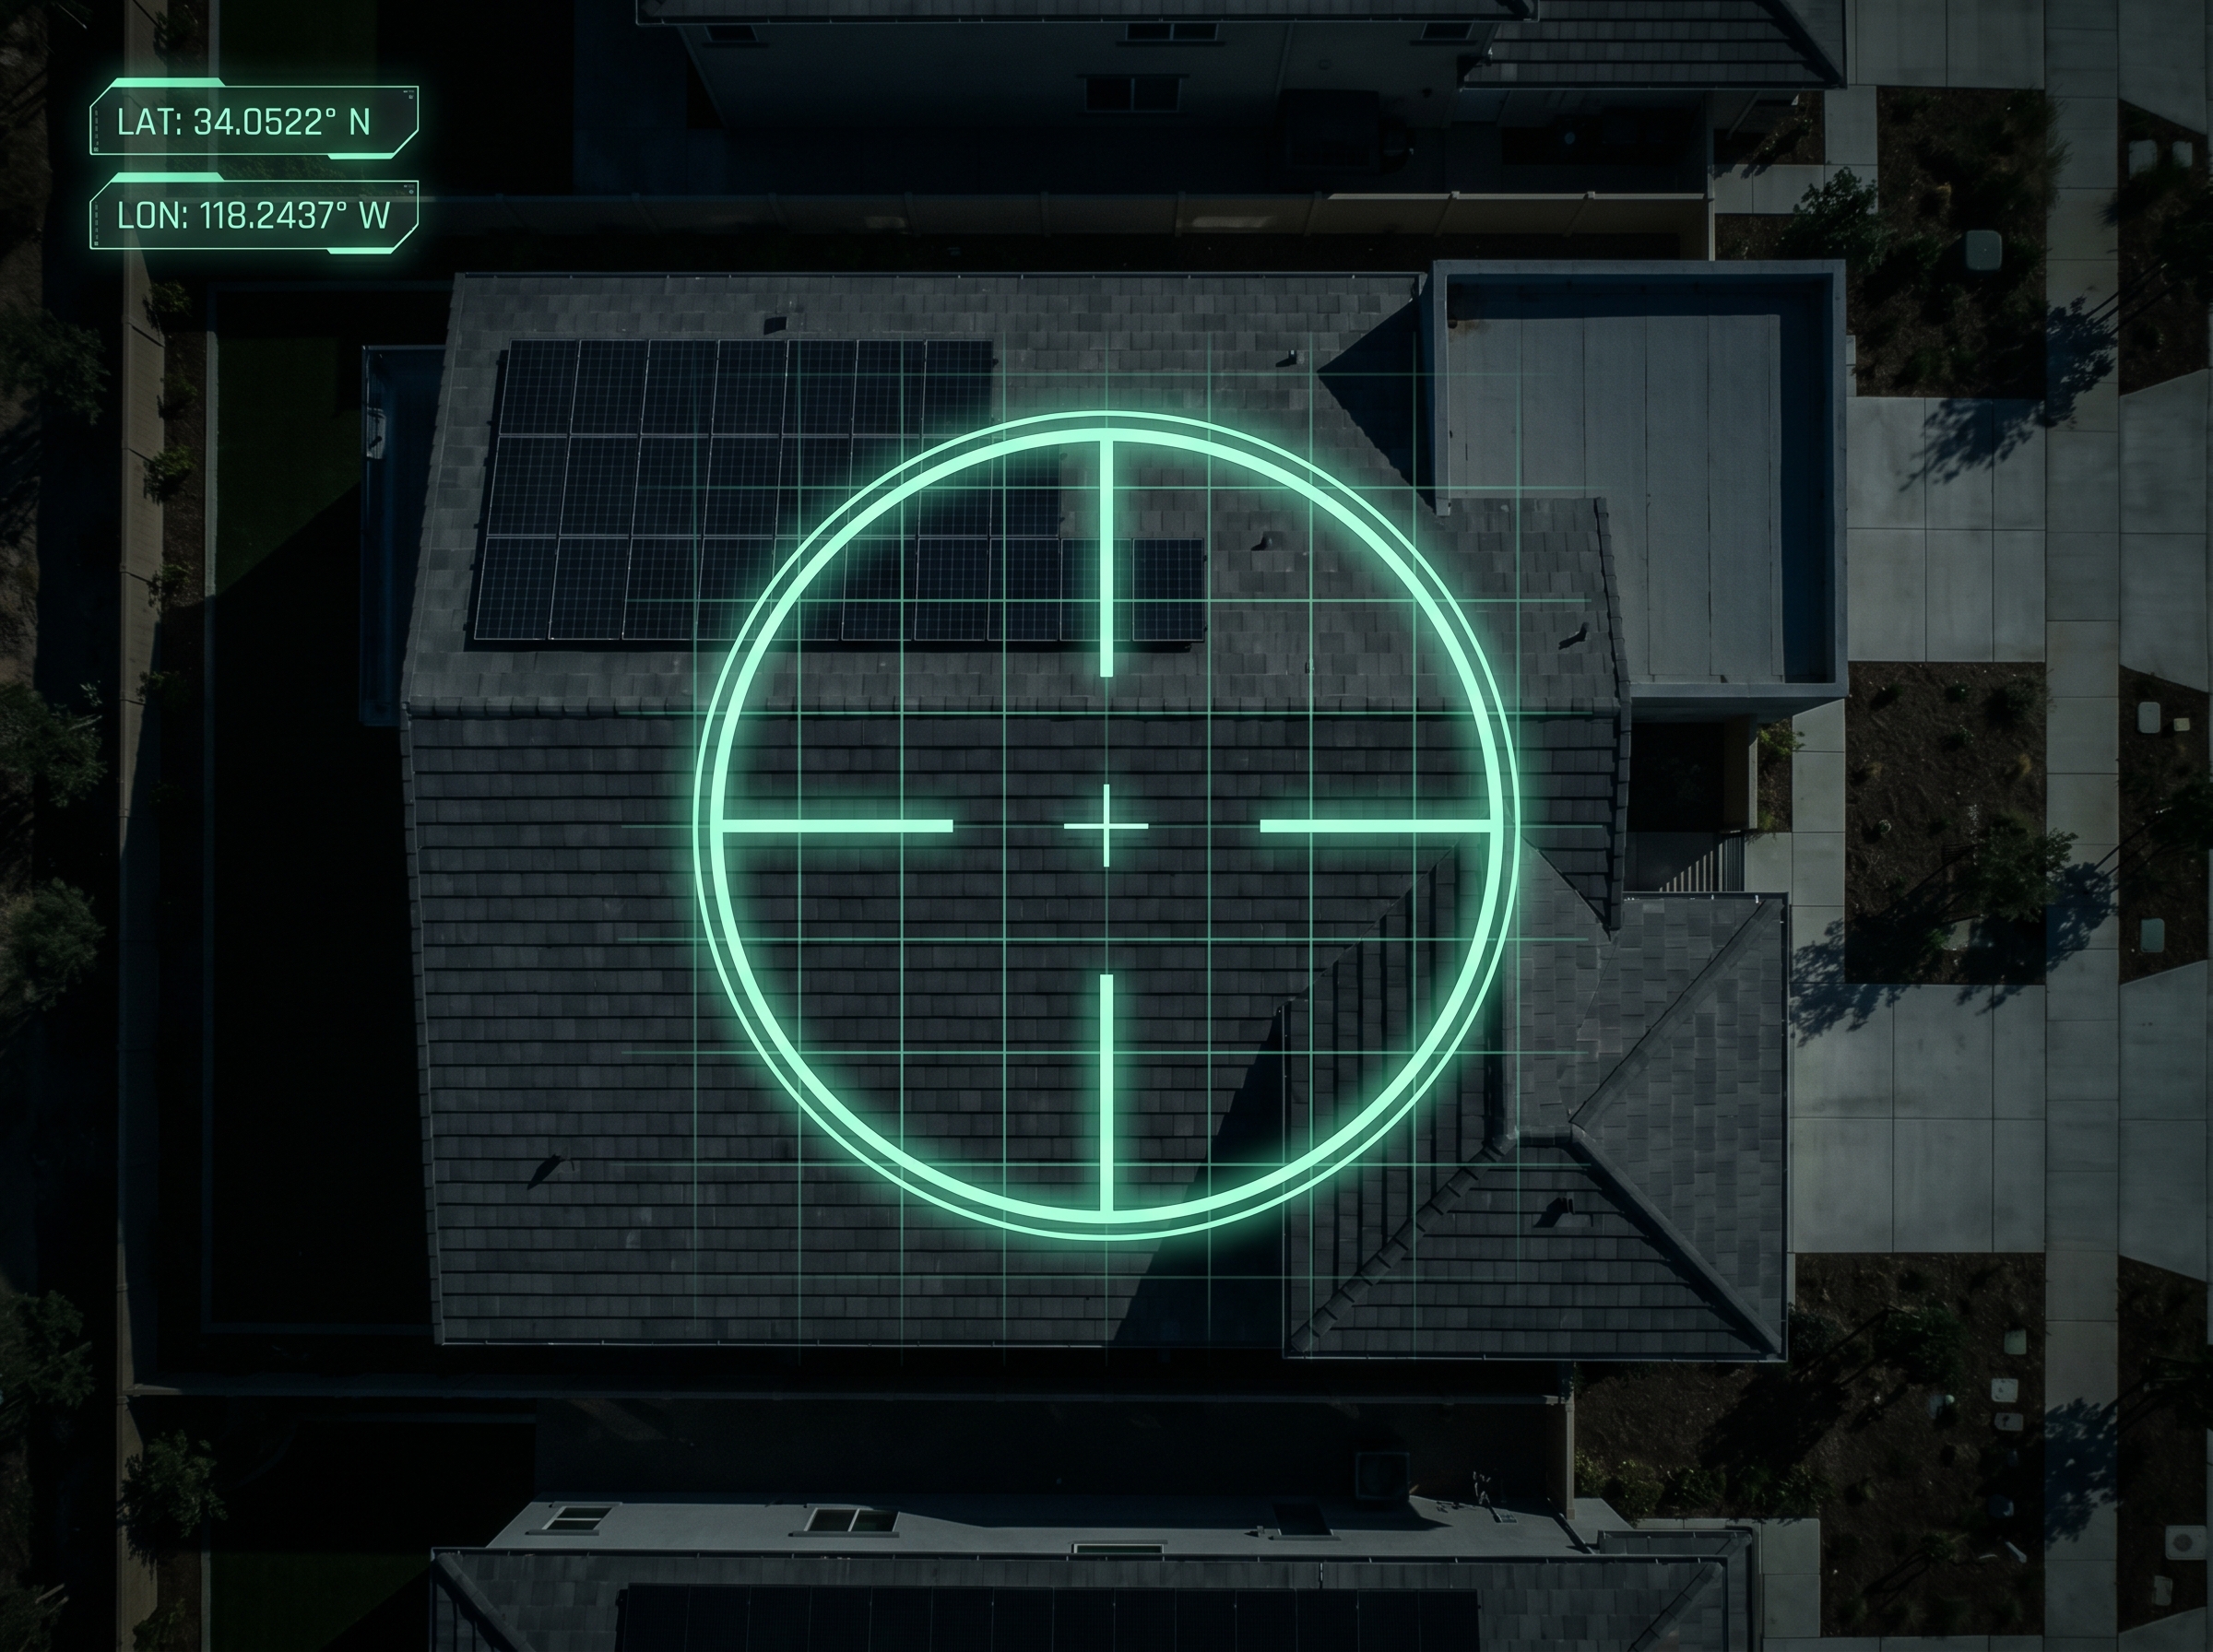
Satellite imagery locks onto the property before measurement begins — see it on a real report →

A typical aerial roof measurement report includes:
- Total roof area, usually expressed in roofing squares (1 square = 100 sq ft)
- Linear measurements for eaves, rakes, ridges, hips, valleys, and flashing
- Pitch for each roof facet
- Labeled diagrams and top-down or oblique imagery of the roof
- A suggested waste factor, often shown as a fixed percentage or a printed table
That is the industry baseline, and it is useful. But for most roofing contractors, the measurements are only half the job.
How Satellite Roof Measurement Works
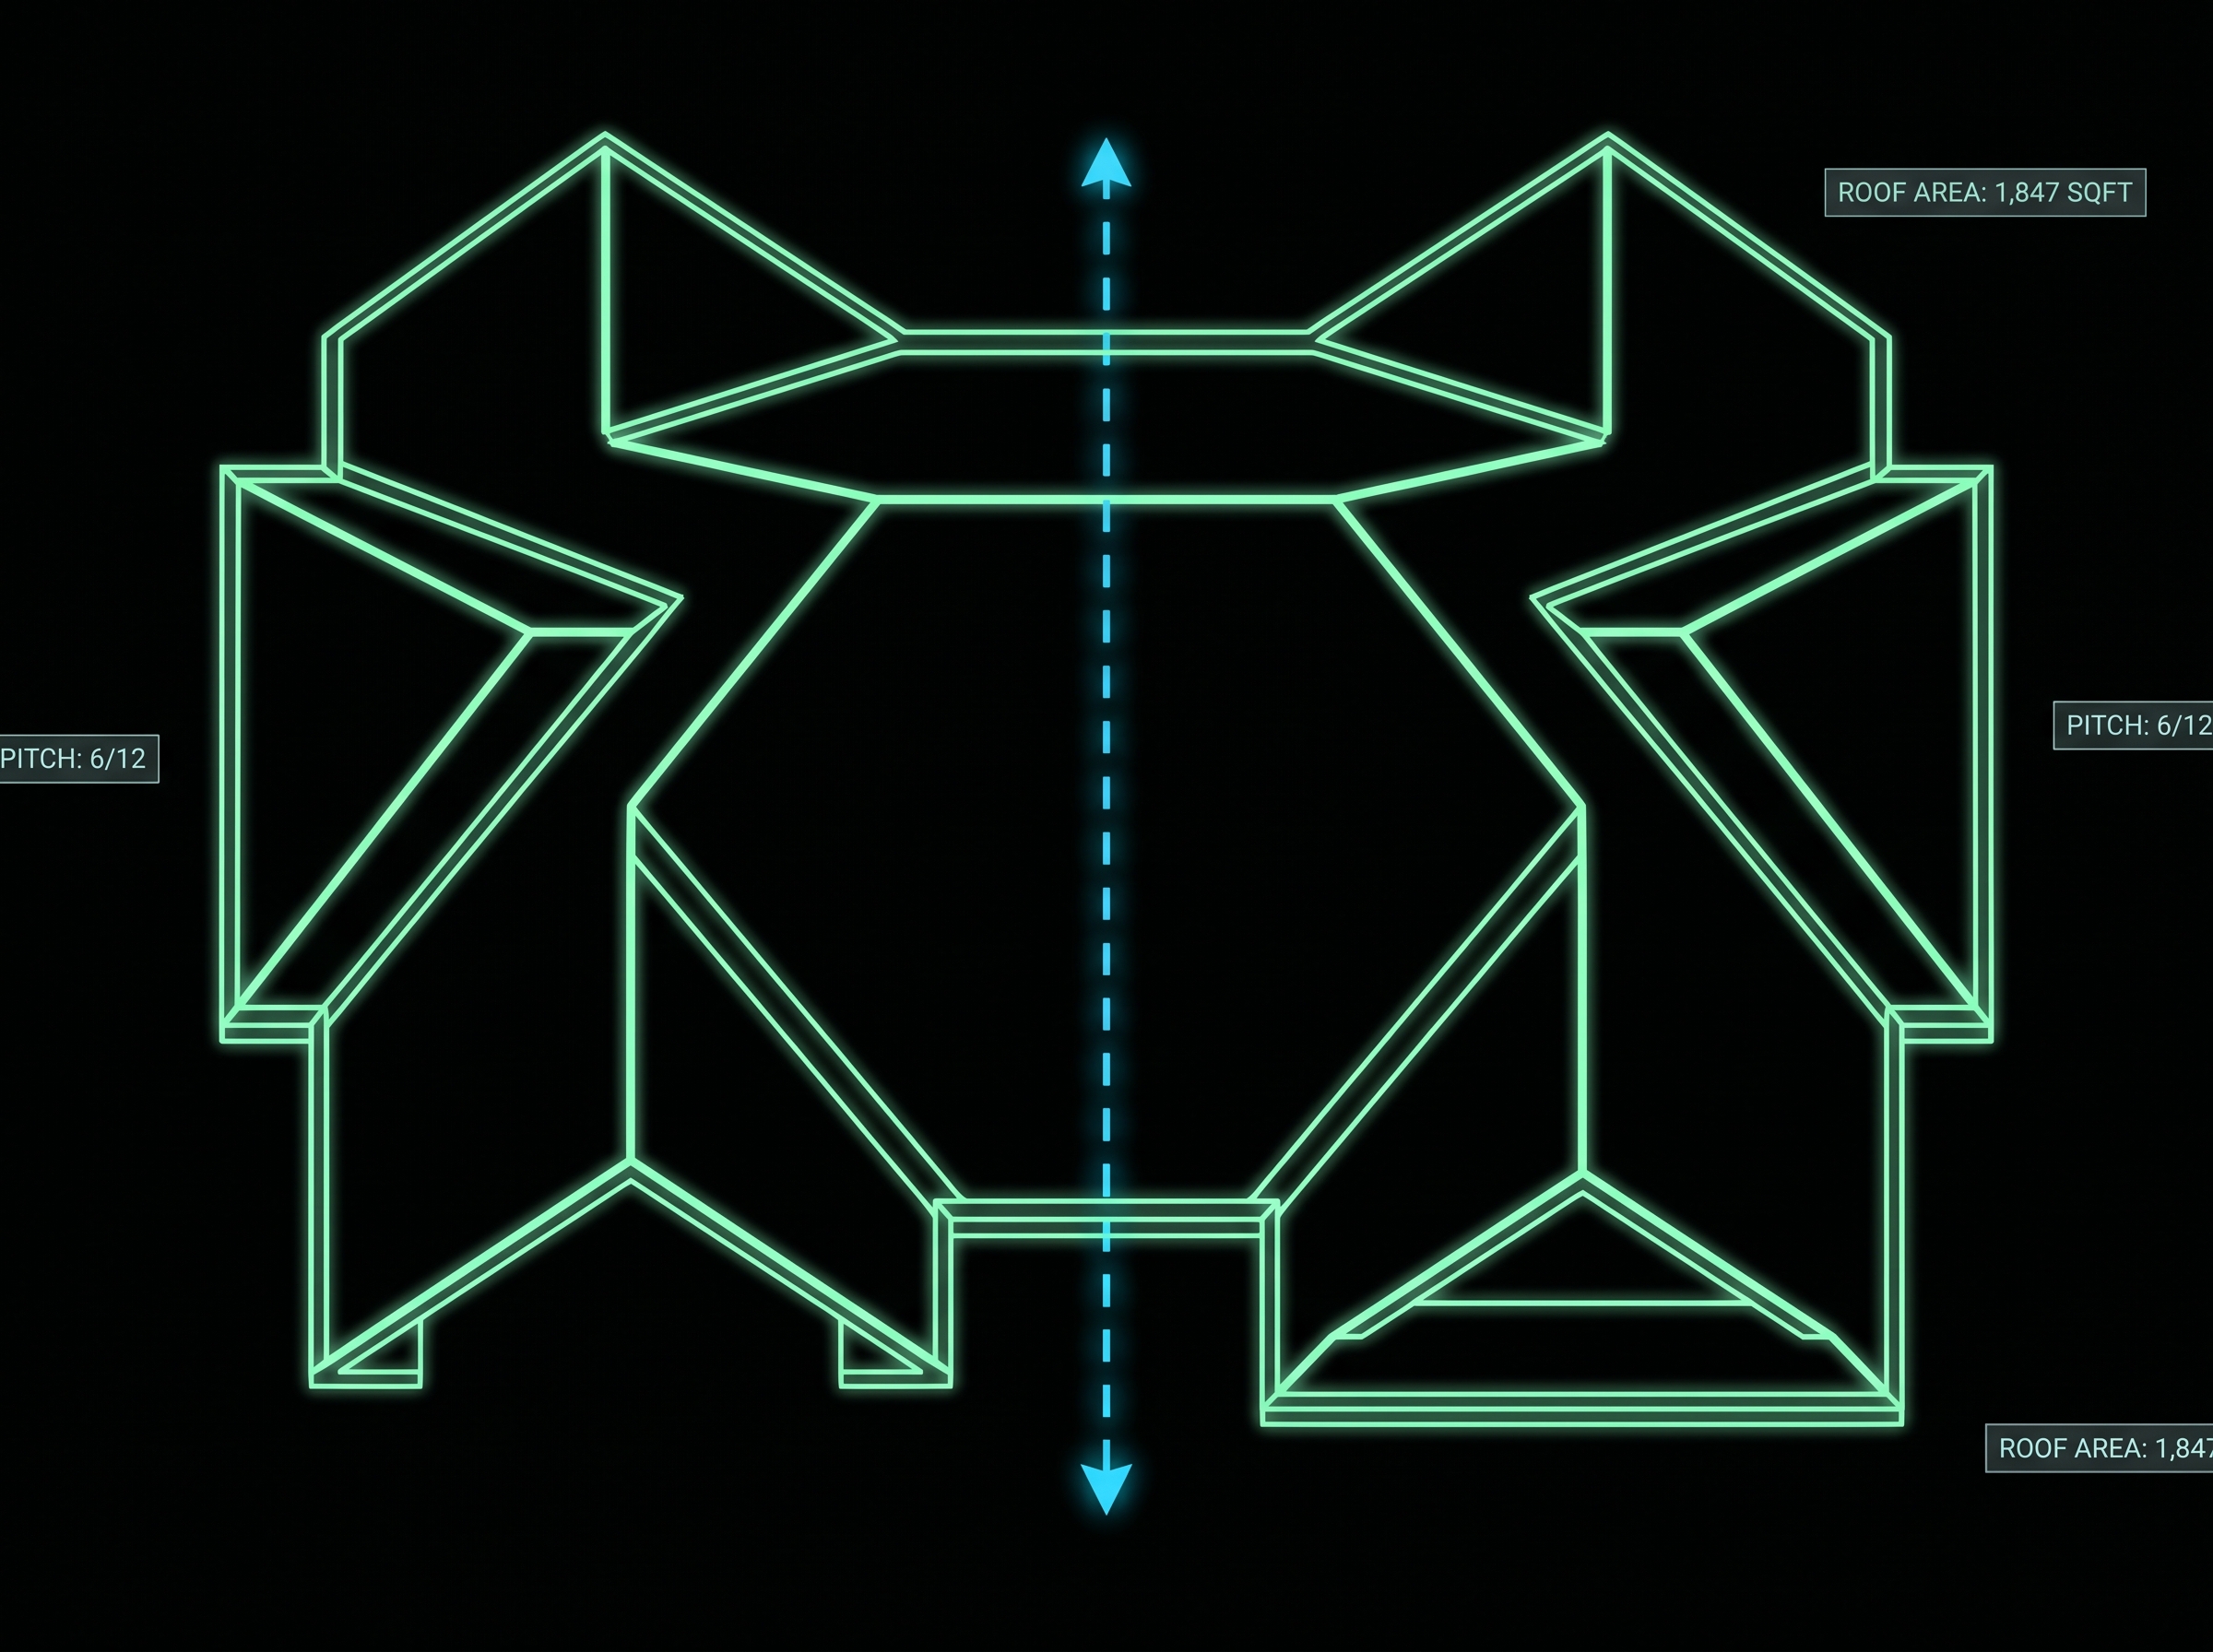
Before we get to what most reports leave out, it helps to know how the numbers are produced in the first place. Satellite roof measurement happens in three steps: high-resolution imagery is pulled for the address, the roof's outline and every interior edge — ridges, hips, valleys — are traced against that imagery, and then geospatial math converts the flat trace into true sloped area using the pitch of each facet. That last step matters: a 2,000 sq ft footprint at a 6:12 pitch is not 2,000 sq ft of shingles. The pitch multiplier is what turns a picture of a roof into an order-ready number.
Every edge gets traced and classified — ridges, hips, valleys, eaves, and rakes →
Where Most Roof Reports Stop Short
Once a report lands in your inbox, someone still has to turn squares into a material order. How many bundles of shingles? At what waste percentage? On most platforms, that math is your problem — a calculator on the tailgate or a spreadsheet at 9 p.m.
Two things go wrong at this step:
- Manual bundle math invites errors. Rounding in the wrong direction, forgetting that a premium shingle covers less area per bundle, or mixing up squares and square feet can leave a crew short on a Saturday morning — or leave you with pallets of unreturnable material.
- Waste percentages are frozen on the page. Most roof reports print waste as a static table or a single suggested percentage. If you want to see the same roof at 12% waste instead of 15%, you are recalculating every line item by hand.
Roof Manager built its roof measurement reports to solve both problems directly on the report itself.
Difference #1: Material Calculations on Every Report
Every Roof Manager roof report includes the material calculation, not just the measurements. By default, the calculation is based on 33.3 sq ft of coverage per bundle — the standard for most laminate and 3-tab asphalt shingles, which pack three bundles to a roofing square.
Here is what that looks like on a real job:
- Measured roof area: 2,470 sq ft (24.7 squares)
- With 10% waste applied: 2,717 sq ft
- Bundles needed: 2,717 ÷ 33.3 = 82 bundles
Instead of doing that math after the report arrives, it is already on the report — for shingles and the rest of the bill of materials, including underlayment, ridge cap, and flashing. You can hand the report to a supplier or drop it straight into an estimate.
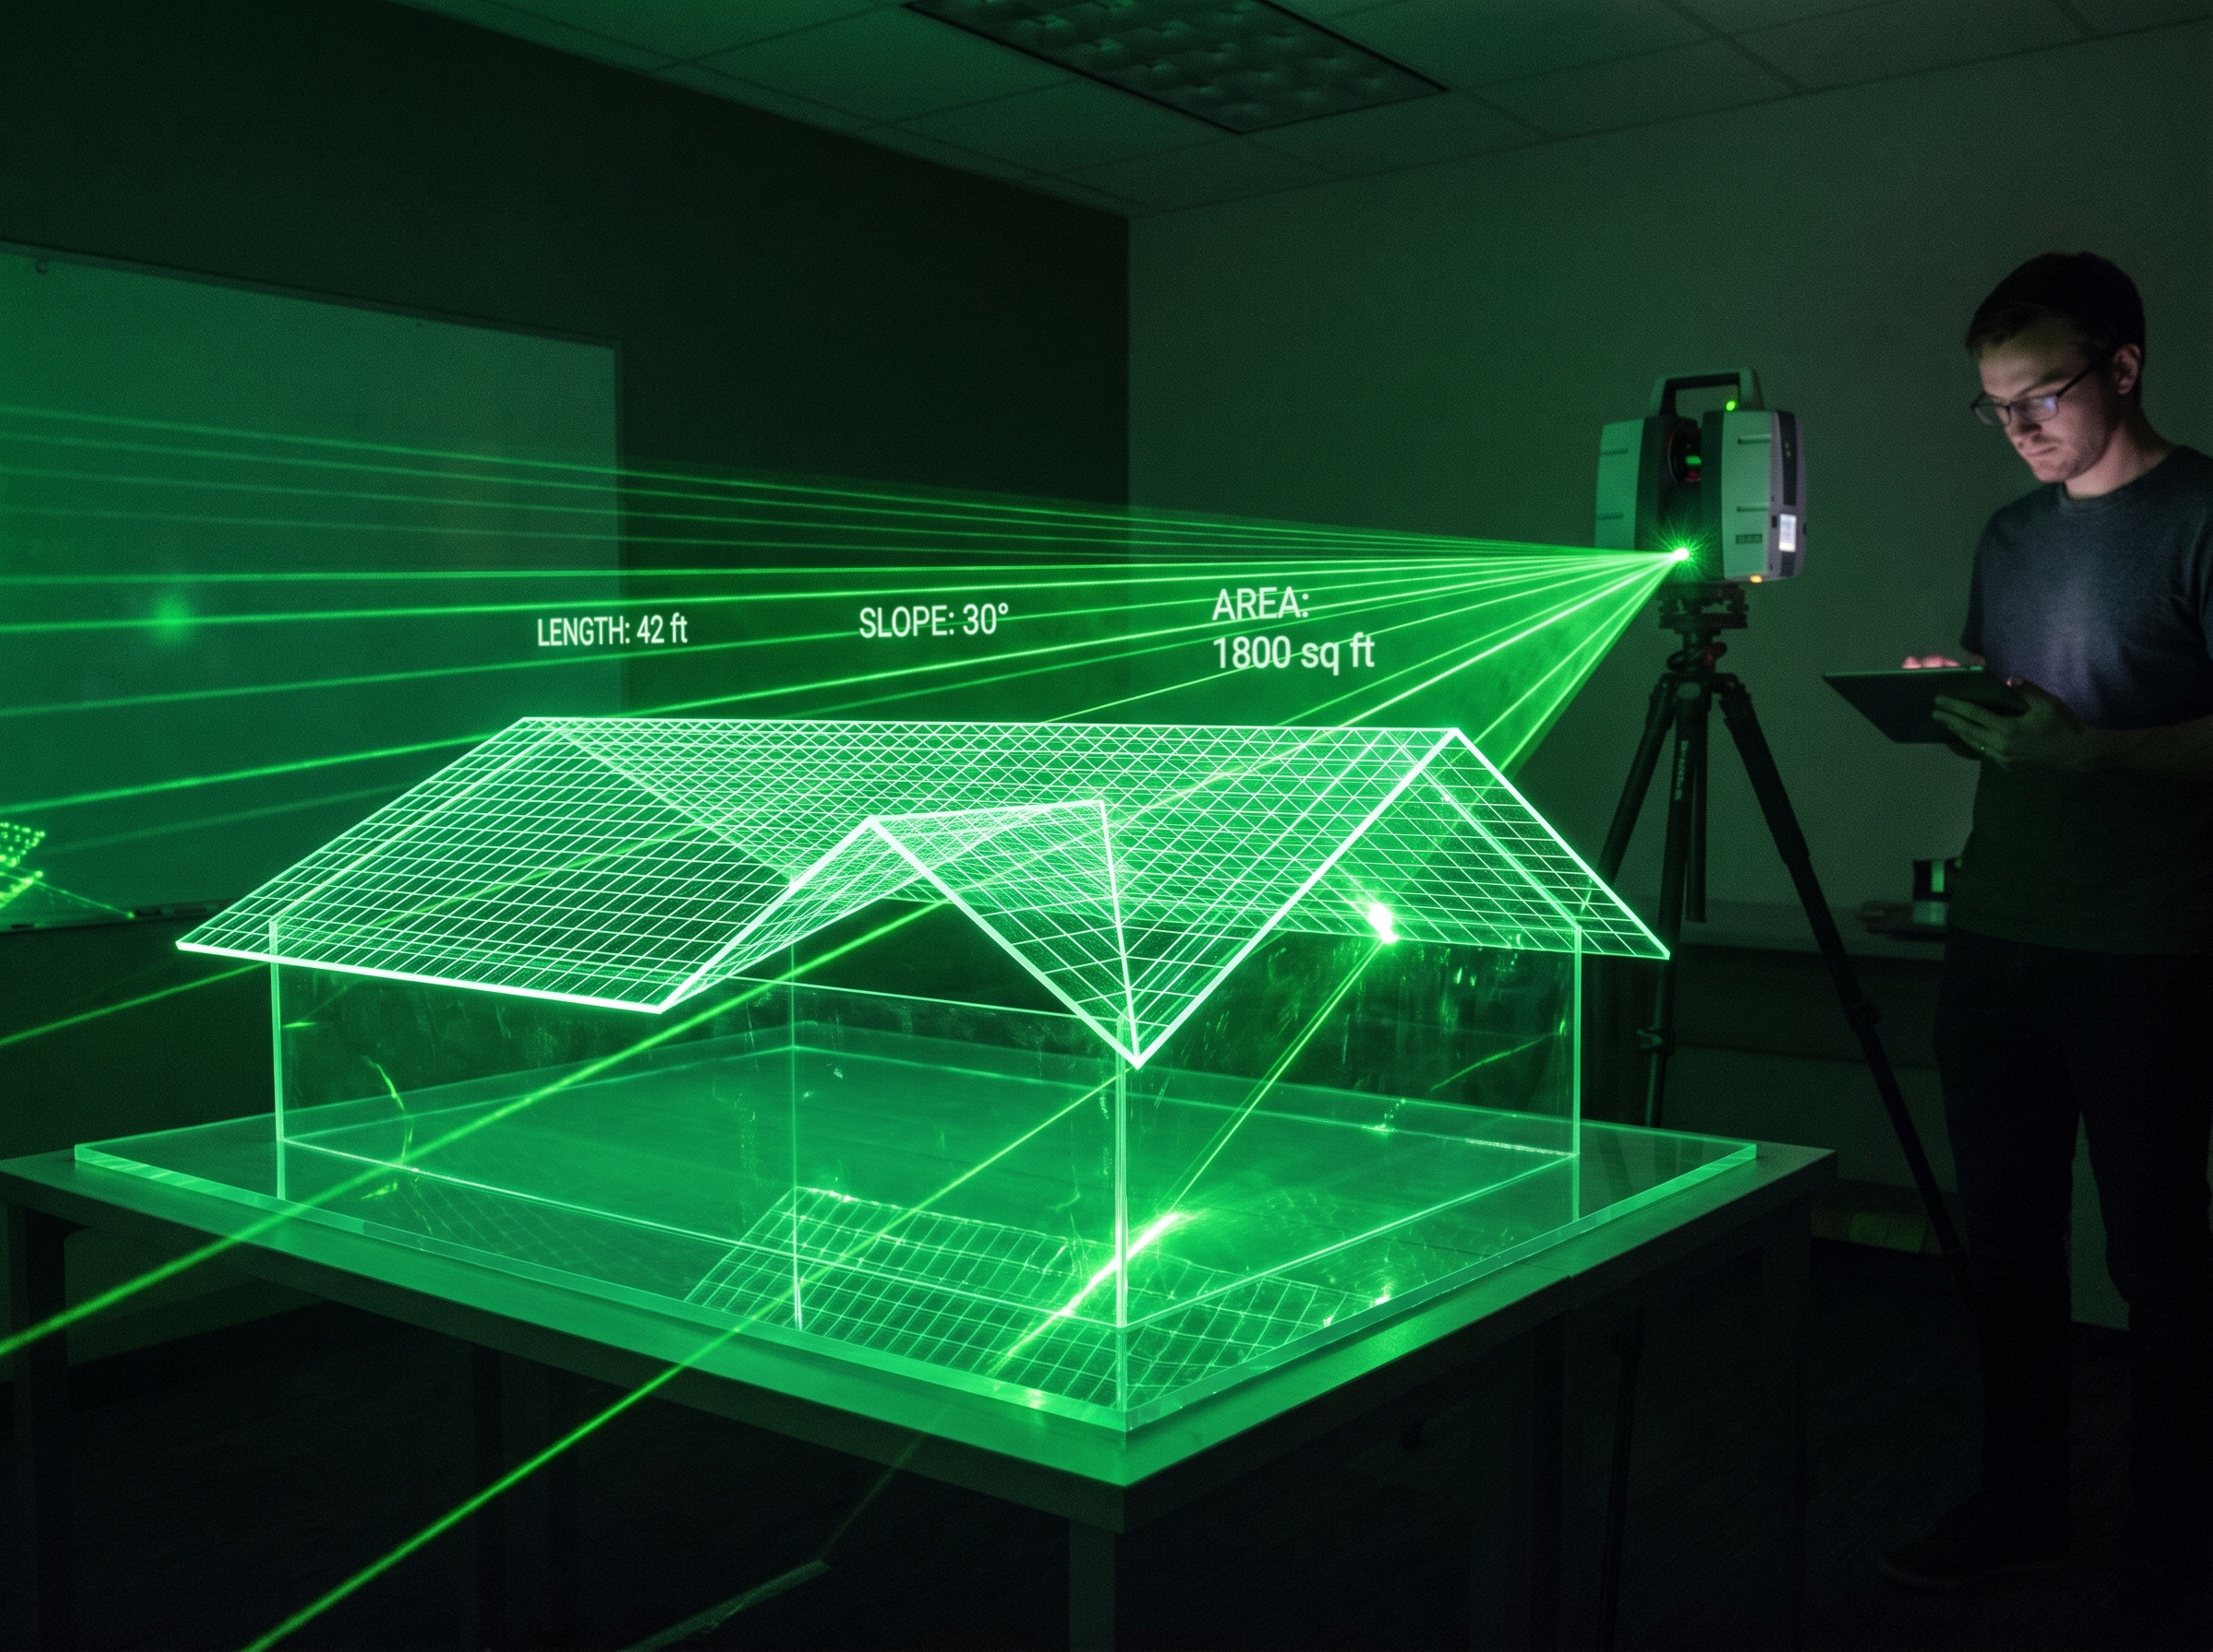
The full 3D measurement model behind the material numbers — open the example report →
Set Your Own Bundle Coverage
Not every shingle packs three bundles to a square. Many designer and premium lines cover only 20–25 sq ft per bundle, which works out to 4 or even 5 bundles per square. Order those at the standard 3-bundles-per-square assumption and you will come up badly short.
Roof Manager handles this with a simple setting: change the square-feet-per-bundle value in your account settings once, and every roof report you order calculates materials using your number. If your crews run a specific product line week after week, your reports reflect it automatically.
Difference #2: A Live Waste Percentage Toggle
Every roof needs a waste factor. Shingles get cut at hips, valleys, and edges; starter courses and ridge caps eat material; some pieces get damaged in handling. The industry rule of thumb is 10–15% waste for most roofs, and 20% or more for complex, cut-up hip-and-valley designs.
The problem is not the concept — it is how reports present it. On a typical roof report, waste is baked in: a printed table of percentages, or one suggested number chosen by an algorithm you cannot adjust.
Roof Manager reports work differently. Open any report and there is a waste percentage toggle at the top. Change the percentage, and every measurement on the report updates live, in real time. No other roof measurement platform offers this on the report itself.
Using the same 2,470 sq ft roof:
| Waste % | Total area to order | Bundles (3 per square) |
|---|---|---|
| 10% | 2,717 sq ft | 82 |
| 15% | 2,841 sq ft | 86 |
| 20% | 2,964 sq ft | 90 |
That is an eight-bundle swing between 10% and 20% — on one mid-sized roof. With the toggle, you can compare scenarios in seconds while you are on the phone with a supplier, pricing a complex roof, or walking a homeowner through the estimate. Over-ordering quietly eats your margin; under-ordering costs you return trips and blown schedules. Seeing the numbers move in real time keeps both in check.
See a Real Example Report
📐 Don't take our word for it — read one.
We publish a real, unedited Roof Manager report generated for a Toronto, ON address: the full measurement breakdown, the labeled roof diagram, the pitch table, and the complete material take-off with bundle counts, exactly as a customer receives it.
A Typical Roof Report vs. a Roof Manager Report
| Feature | Typical roof measurement report | Roof Manager report |
|---|---|---|
| Roof area, squares, and pitch | Included | Included |
| Ridge, hip, valley, eave, and rake lengths | Included | Included |
| Material calculation (bundle counts) | Rarely included | On every report |
| Bundle coverage assumption | Fixed, if present at all | Adjustable in your settings |
| Waste percentage | Static table or single suggestion | Live toggle — report recalculates in real time |
| Delivery time | Varies by provider, often hours to days | About 60 minutes |
| What happens next | Export to a separate estimating tool | Flows into built-in estimating, proposals, and invoicing |
What Else Comes With Every Roof Manager Report
The material calculation and waste toggle are the standouts, but the fundamentals are covered too. Roof Manager reports are built from high-resolution satellite imagery with roughly 99% measurement accuracy, delivered in about an hour, and include a full edge breakdown — ridge, hip, valley, eave, and rake — plus pitch for every facet.
Reports are available for addresses across all 50 U.S. states and every Canadian province. And because Roof Manager is a full roofing software platform, each report flows straight into estimates, proposals, invoices, and your sales pipeline — so the numbers you measured are the numbers you quote, without re-typing anything.
From Report to Estimate: How the Numbers Flow
The reason built-in material math matters is what happens after the report. In most shops, the measurement report is a PDF in one tab and the estimate is a spreadsheet in another, and someone re-types every number in between — which is exactly where transposition errors creep in. In Roof Manager, the report is the starting point of the estimate: the measured quantities, the bundle counts at your chosen waste percentage, and the edge lengths carry straight into a branded proposal, and the accepted proposal carries into the invoice. One set of numbers from first measurement to final payment.
That same flow is why the waste toggle earns its keep on repriced jobs. When a supplier quote comes back higher than expected, or a homeowner asks what a tighter budget looks like, you re-toggle the waste assumption and the whole downstream estimate moves with it — no re-measuring, no re-typing. See current report pricing here.
Frequently Asked Questions
What is a roof measurement report?
A roof measurement report is a document generated from satellite or aerial imagery that provides a roof's complete dimensions — area, pitch, ridges, hips, valleys, eaves, and rakes — without an on-site measurement. Contractors use them to estimate jobs, order materials, and quote faster.
How many bundles of shingles are in a square?
Most standard asphalt shingles pack 3 bundles per roofing square, with each bundle covering about 33.3 sq ft. Premium and designer shingles can require 4–5 bundles per square. Roof Manager reports calculate bundles automatically and let you set your own coverage-per-bundle value in settings.
What waste percentage should I use on a roof?
Most roofs fall in the 10–15% waste range, while complex hip-and-valley roofs can require 20% or more. Roof Manager reports include a live waste percentage toggle, so you can compare the material totals at different waste levels instantly instead of committing to one printed number.
Can I change the bundle size Roof Manager uses for material calculations?
Yes. The default is 33.3 sq ft per bundle (3 bundles per square), and you can change the coverage value in your account settings. Every report you order afterward calculates materials using your bundle size.
How fast are Roof Manager roof reports delivered?
Roof Manager delivers roof measurement reports in about 60 minutes, so you can measure, price, and quote a job the same day you get the lead.
Does Roof Manager work in both Canada and the United States?
Yes. Roof Manager provides roof measurement reports for all 50 U.S. states and every Canadian province.
Where can I see an example of a roof measurement report?
Roof Manager publishes a real, unedited example report generated for a Toronto, ON address — including the roof diagram, pitch table, and full material take-off. You can view the example roof measurement report at roofmanager.ca/sample-report.
Order a Report and See the Difference
The fastest way to see what a report with built-in material calculations and a live waste toggle changes about your day is to run one on a real address. Create a free account — your first reports are free, no credit card required — and have the numbers in about an hour. If you want to look before you sign up, the example report is one click away.